| Structural Business Statistics, 2016 - 2018 | ||||||
| Percentage change | ||||||
| 2016 | 2017 | 2018 | 2017 - 2018 | 2016 - 2018 | ||
| Enterprises | No. | 262,204 | 283,244 | 281,408 | -0.6 | 7.3 |
| Persons Engaged | No. | 1,444,425 | 1,522,182 | 1,573,271 | 3.4 | 8.9 |
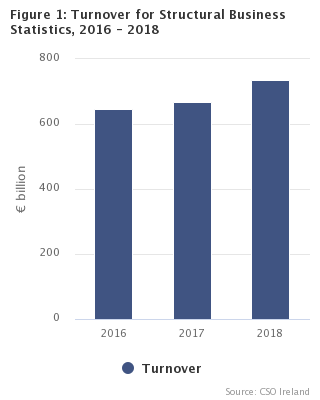
| Turnover | €m | 644,975 | 667,699 | 734,328 | 10.0 | 13.9 |
| Gross Value Added | €m | 190,934 | 210,325 | 235,376 | 11.9 | 23.3 |
| Structural Business Statistics includes all Industrial, Distribution and Services & Building and Construction enterprises in Ireland. | ||||||
This release provides details of individual surveys in the Structural Business Economy i.e. Census of Industrial Production, Annual Services Inquiry & Building and Construction Inquiry. It also analyses these sectors by size class of enterprise and nationality of ownership.
| Table 1 Industrial sector key variables, 2016 - 2018 | |||||
| Percentage change | |||||
| 2016 | 2017 | 2018 | 2017 - 2018 | ||
| Industry (B-E) | |||||
| Enterprises | No. | 17,555 | 18,817 | 18,703 | -0.6 |
| of which; SMEs (<250) | 17,380 | 18,639 | 18,527 | -0.6 | |
| Large (250+) | 175 | 178 | 176 | -1.1 | |
| Persons Engaged | No. | 235,352 | 242,966 | 250,635 | 3.2 |
| of which; SMEs (<250) | 121,921 | 125,596 | 128,787 | 2.5 | |
| Large (250+) | 113,431 | 117,370 | 121,848 | 3.8 | |
| Turnover | €m | 227,154 | 238,601 | 268,289 | 12.4 |
| of which; SMEs (<250) | 41,571 | 44,328 | 47,006 | 6.0 | |
| Large (250+) | 185,583 | 194,273 | 221,283 | 13.9 | |
| Gross Value Added | €m | 93,264 | 103,029 | 110,470 | 7.2 |
| of which; SMEs (<250) | 15,017 | 15,045 | 13,953 | -7.3 | |
| Large (250+) | 78,247 | 87,984 | 96,517 | 9.7 | |
| Small and medium enterprises (SMEs) have less than 250 persons engaged. Large enterprises have 250 or more persons engaged. | |||||
| Totals may differ due to rounding. | |||||
Persons engaged in Industrial sector increased 3.2% in 2018
*Please note that Statbank tables for Industry for 2018 are unavailable at present and will be published at a later date.
| X-axis label | Turnover | Gross Value Added |
|---|---|---|
| 2016 | 227.154 | 93.264 |
| 2017 | 238.601 | 103.029 |
| 2018 | 268.289 | 110.47 |
| Large (250+ persons engaged) | SMEs (<250 persons engaged) | |
| 2016 | 113431 | 121921 |
| 2017 | 117370 | 125596 |
| 2018 | 121848 | 128787 |
| X-axis label | Large (250+ persons engaged) | SMEs (<250 persons engaged) |
|---|---|---|
| 2016 | 78.247 | 15.017 |
| 2017 | 87.984 | 15.045 |
| 2018 | 96.517 | 13.953 |
| Table 2 Distribution sector and Services sector key variables, 2016 - 2018 | |||||
| Percentage change | |||||
| 2016 | 2017 | 2018 | 2017 - 2018 | ||
| Distribution (G) | |||||
| Enterprises | No. | 46,595 | 48,598 | 47,789 | -1.7 |
| of which; SMEs (<250) | 46,501 | 48,498 | 47,680 | -1.7 | |
| Large (250+) | 94 | 100 | 109 | 9.0 | |
| Persons Engaged | No. | 356,057 | 367,405 | 374,968 | 2.1 |
| of which; SMEs (<250) | 257,718 | 264,684 | 267,160 | 0.9 | |
| Large (250+) | 98,339 | 102,721 | 107,808 | 5.0 | |
| Turnover | €m | 183,434 | 186,677 | 182,394 | -2.3 |
| of which; SMEs (<250) | 154,035 | 158,820 | 152,308 | -4.1 | |
| Large (250+) | 29,399 | 27,857 | 30,085 | 8.0 | |
| Gross Value Added | €m | 22,226 | 22,394 | 23,465 | 4.8 |
| of which; SMEs (<250) | 16,919 | 17,158 | 18,332 | 6.8 | |
| Large (250+) | 5,307 | 5,237 | 5,133 | -2.0 | |
| Services (H-N, R92,R93,S95,S96 excluding K) | |||||
| Enterprises | No. | 146,486 | 158,574 | 157,290 | -0.8 |
| of which; SMEs (<250) | 146,238 | 158,311 | 156,992 | -0.8 | |
| Large (250+) | 248 | 263 | 298 | 13.3 | |
| Persons Engaged | No. | 732,675 | 774,572 | 803,147 | 3.7 |
| of which; SMEs (<250) | 540,538 | 569,159 | 579,576 | 1.8 | |
| Large (250+) | 192,137 | 205,413 | 223,571 | 8.8 | |
| Turnover | €m | 214,959 | 217,552 | 254,492 | 17.0 |
| of which; SMEs (<250) | 110,798 | 109,517 | 114,141 | 4.2 | |
| Large (250+) | 104,160 | 108,036 | 140,351 | 29.9 | |
| Gross Value Added | €m | 68,484 | 75,607 | 90,718 | 20.0 |
| of which; SMEs (<250) | 41,411 | 40,812 | 46,407 | 13.7 | |
| Large (250+) | 27,073 | 34,795 | 44,311 | 27.3 | |
| Small and medium enterprises (SMEs) have less than 250 persons engaged. Large enterprises have 250 or more persons engaged. | |||||
| Totals may differ due to rounding. | |||||
The number of enterprises in both Distribution and Services sectors decreased slightly in 2018
| X-axis label | Turnover | Gross Value Added |
|---|---|---|
| 2016 | 183.434 | 22.226 |
| 2017 | 186.677 | 22.394 |
| 2018 | 182.394 | 23.465 |
| Large (250+ persons engaged) | SMEs (<250 persons engaged) | |
| 2016 | 98339 | 257718 |
| 2017 | 102721 | 264684 |
| 2018 | 107808 | 267160 |
| X-axis label | Large (250+ persons engaged) | SMEs (<250 persons engaged) |
|---|---|---|
| 2016 | 5.307 | 16.919 |
| 2017 | 5.237 | 17.158 |
| 2018 | 5.133 | 18.332 |
| X-axis label | Turnover | Gross Value Added |
|---|---|---|
| 2016 | 214.959 | 68.484 |
| 2017 | 217.552 | 75.607 |
| 2018 | 254.492 | 90.718 |
| Large (250+ persons engaged) | SMEs (<250 persons engaged) | |
| 2016 | 192137 | 540538 |
| 2017 | 205413 | 569159 |
| 2018 | 223571 | 579576 |
| X-axis label | Large (250+ persons engaged) | SMEs (<250 persons engaged) |
|---|---|---|
| 2016 | 27.073 | 41.411 |
| 2017 | 34.795 | 40.812 |
| 2018 | 44.311 | 46.407 |
| Table 3 Building and Construction sector key variables, 2016 - 2018 | |||||
| Percentage change | |||||
| 2016 | 2017 | 2018 | 2017 - 2018 | ||
| Building and Construction (F) | |||||
| Enterprises | No. | 51,568 | 57,255 | 57,626 | 0.6 |
| of which; SMEs (<250) | 51,554 | 57,238 | 57,605 | 0.6 | |
| Large (250+) | 14 | 17 | 21 | 23.5 | |
| Persons Engaged | No. | 120,341 | 137,239 | 144,521 | 5.3 |
| of which; SMEs (<250) | 113,558 | 128,303 | 133,932 | 4.4 | |
| Large (250+) | 6,783 | 8,936 | 10,589 | 18.5 | |
| Turnover | €m | 19,428 | 24,869 | 29,153 | 17.2 |
| of which; SMEs (<250) | 17,395 | 22,492 | 25,558 | 13.6 | |
| Large (250+) | 2,033 | 2,376 | 3,595 | 51.3 | |
| Gross Value Added | €m | 6,960 | 9,295 | 10,723 | 15.4 |
| of which; SMEs (<250) | 6,296 | 8,482 | 9,480 | 11.8 | |
| Large (250+) | 664 | 813 | 1,243 | 52.9 | |
| Small and medium enterprises (SMEs) have less than 250 persons engaged. Large enterprises have 250 or more persons engaged. | |||||
| Totals may differ due to rounding. | |||||
Annual increase of 17.2% in turnover in Building and Construction
| X-axis label | Turnover | Gross Value Added |
|---|---|---|
| 2016 | 19.428 | 6.96 |
| 2017 | 24.869 | 9.295 |
| 2018 | 29.153 | 10.723 |
| X-axis label | Large (250+ persons engaged) | SMEs (<250 persons engaged) |
|---|---|---|
| 2016 | 6783 | 113558 |
| 2017 | 8936 | 128303 |
| 2018 | 10589 | 133932 |
| X-axis label | Large (250+ persons engaged) | SMEs (<250 persons engaged) |
|---|---|---|
| 2016 | 0.664 | 6.296 |
| 2017 | 0.813 | 8.482 |
| 2018 | 1.243 | 9.48 |
| Table 4 Breakdown of persons engaged and Gross Value Added by sector, nationality of ownership and size class, 2018 | ||
| Persons engaged | Gross Value Added | |
| No. | €m | |
| Industry - Irish owned | 140,059 | 12,805 |
| of which; SMEs (<250) | 99,081 | 7,033 |
| Large (250+) | 40,978 | 5,772 |
| Industry - Foreign owned | 110,576 | 97,665 |
| of which; SMEs (<250) | 29,706 | 6,920 |
| Large (250+) | 80,870 | 90,745 |
| Industry- Total | 250,635 | 110,470 |
| of which; SMEs (<250) | 128,787 | 13,953 |
| Large (250+) | 121,848 | 96,517 |
| Distribution - Irish owned | 268,525 | 12,805 |
| of which; SMEs (<250) | 233,823 | 11,108 |
| Large (250+) | 34,702 | 1,697 |
| Distribution - Foreign owned | 106,443 | 10,660 |
| of which; SMEs (<250) | 33,337 | 7,224 |
| Large (250+) | 73,106 | 3,436 |
| Distribution - Total | 374,968 | 23,465 |
| of which; SMEs (<250) | 267,160 | 18,332 |
| Large (250+) | 107,808 | 5,133 |
| Services - Irish owned | 625,172 | 43,721 |
| of which; SMEs (<250) | 516,445 | 34,751 |
| Large (250+) | 108,727 | 8,970 |
| Services - Foreign owned | 177,975 | 46,997 |
| of which; SMEs (<250) | 63,131 | 11,656 |
| Large (250+) | 114,844 | 35,341 |
| Services - Total | 803,147 | 90,718 |
| of which; SMEs (<250) | 579,576 | 46,407 |
| Large (250+) | 223,571 | 44,311 |
| Building and construction - Irish owned | 135,233 | 9,671 |
| of which; SMEs (<250) | 130,718 | 8,796 |
| Large (250+) | 4,515 | 875 |
| Building and construction - Foreign owned | 9,288 | 1,051 |
| of which; SMEs (<250) | 3,214 | 683 |
| Large (250+) | 6,074 | 368 |
| Building and construction - Total | 144,521 | 10,723 |
| of which; SMEs (<250) | 133,932 | 9,480 |
| Large (250+) | 10,589 | 1,243 |
| All sectors - Irish owned | 1,168,989 | 79,002 |
| of which; SMEs (<250) | 980,067 | 61,688 |
| Large (250+) | 188,922 | 17,314 |
| All sectors - Foreign owned | 404,282 | 156,373 |
| of which; SMEs (<250) | 129,388 | 26,483 |
| Large (250+) | 274,894 | 129,890 |
| All sectors - Total | 1,573,271 | 235,376 |
| of which; SMEs (<250) | 1,109,455 | 88,172 |
| Large (250+) | 463,816 | 147,204 |
| Small and medium enterprises (SMEs) have less than 250 persons engaged. Large enterprises have 250 or more persons engaged. | ||
| Totals may differ due to rounding. | ||
| SMEs (<250 persons engaged) | Large (250+ persons engaged) | |
| Industry - Irish | 70.7 | 29.3 |
| Industry - Foreign | 26.9 | 73.1 |
| Distribution - Irish | 87.1 | 12.9 |
| Distribution - Foreign | 31.3 | 68.7 |
| Services- Irish | 82.6 | 17.4 |
| Services - Foreign | 35.5 | 64.5 |
| Building and Construction - Irish | 96.7 | 3.3 |
| Building and Construction - Foreign | 34.6 | 65.4 |
| All sectors - Irish | 83.8 | 16.2 |
| All sectors - Foreign | 32 | 68 |
| SMEs (<250 persons engaged) | Large (250+ persons engaged) | |
| Industry - Irish | 54.9 | 45.1 |
| Industry - Foreign | 7.1 | 92.9 |
| Distribution - Irish | 86.7 | 13.3 |
| Distribution - Foreign | 67.8 | 32.2 |
| Services- Irish | 79.5 | 20.5 |
| Services - Foreign | 24.8 | 75.2 |
| Building and Construction - Irish | 91 | 9 |
| Building and Construction - Foreign | 65 | 35 |
| All sectors - Irish | 78.1 | 21.9 |
| All sectors - Foreign | 16.9 | 83.1 |
The background notes and detailed methodology for the surveys used to compile the Structural Business Statistics release can be found as follows:
Census of Industrial Production Enterprises
Building and Construction Inquiry
 Hide Background Notes
Scan the QR code below to view this release online or go to
http://www.cso.ie/en/releasesandpublications/er/sbs/structuralbusinessstatistics2018/
 Show Table 1 Industrial sector key variables, 2016 - 2018
 Hide Table 1 Industrial sector key variables, 2016 - 2018