| Region | Net Subsidies | Operating Surplus | Net Subsidies as a % of Operating Surplus |
| €m | €m | % | |
| Border | 248.0 | 352.2 | 70.4 |
| Midland | 147.6 | 140.1 | 105.3 |
| West | 274.7 | 365.4 | 75.2 |
| Border, Midland and Western | 670.3 | 857.8 | 78.1 |
| Mid-East and Dublin | 127.8 | 276.3 | 46.3 |
| Mid-West | 214.6 | 339.1 | 63.3 |
| South-East | 212.8 | 378.2 | 56.3 |
| South-West | 263.1 | 647.8 | 40.6 |
| Southern and Eastern | 818.3 | 1,641.4 | 49.9 |
| State | 1,488.6 | 2,499.2 | 59.6 |
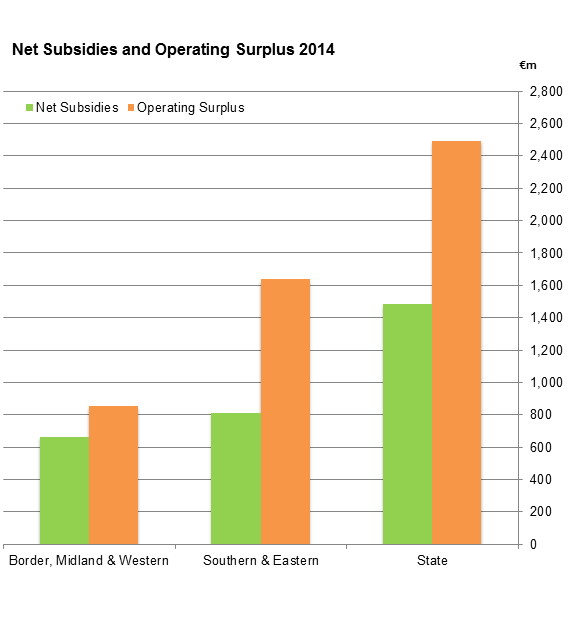
In 2014, net subsidies accounted for 59.6% of agricultural income (operating surplus) at State level. In the Border, Midland and Western region, net subsidies accounted for 78.1% of agricultural income, while in the Southern and Eastern region net subsidies accounted for 49.9% of agricultural income. See above table, graph and Table 3.
An analysis of agriculture in the regions in the year 2014 shows that:
| BMW | SE | |
| Operating surplus | 34.3216578157331 | 65.678342184267 |
| Net Subsidies | 45.0302830112693 | 54.9697169887307 |
| Intermediate consumption | 36.6529627827172 | 63.3470372172828 |
| Goods output at producer prices | 34.7737749410515 | 65.2262250589485 |
| Cereals | 19.6934325399585 | 80.3065674600415 |
| Potatoes | 26.3990938494485 | 73.6009061505515 |
| Milk | 19.9279087856594 | 80.0720912143406 |
| Sheep | 54.4675090252707 | 45.5324909747292 |
| Pigs | 47.8291631826076 | 52.1708368173924 |
| Cattle | 41.3312747815713 | 58.6687252184287 |
| Number of Farms* | 52.8249678249678 | 47.1750321750322 |
| Agricultural area* | 44.1977107152691 | 55.8022892847309 |
| Table 1 Regional Agricultural Accounts at Nuts 2 level 2013-2014 | ||||||||
| Item | Border, Midland and Western | Southern and Eastern | State | |||||
| 2013 | 2014 | 2013 | 2014 | 2013 | 2014 | |||
| Livestock | 1,371.1 | 1,334.1 | 1,780.3 | 1,730.3 | 3,151.5 | 3,064.4 | ||
| of which: | ||||||||
| cattle | 895.7 | 831.7 | 1,256.1 | 1,180.6 | 2,151.8 | 2,012.3 | ||
| pigs | 225.0 | 225.4 | 250.7 | 245.9 | 475.7 | 471.3 | ||
| sheep | 110.3 | 126.8 | 93.4 | 106.0 | 203.8 | 232.8 | ||
| Livestock products | 439.9 | 455.2 | 1,693.7 | 1,697.7 | 2,133.6 | 2,152.9 | ||
| of which: | ||||||||
| milk | 400.5 | 417.2 | 1,672.9 | 1,676.3 | 2,073.4 | 2,093.4 | ||
| Crops | 773.1 | 644.8 | 1,332.0 | 1,137.8 | 2,105.1 | 1,782.6 | ||
| of which: | ||||||||
| cereals | 56.5 | 55.2 | 233.0 | 225.3 | 289.6 | 280.5 | ||
| root crops | 43.4 | 23.1 | 121.1 | 64.5 | 164.5 | 87.6 | ||
| forage plants | 511.0 | 392.0 | 784.3 | 647.2 | 1,295.3 | 1,039.3 | ||
| Goods output at producer prices | 2,584.1 | 2,434.1 | 4,806.0 | 4,565.7 | 7,390.1 | 6,999.8 | ||
| Contract work | 123.2 | 119.0 | 242.5 | 242.9 | 365.8 | 361.9 | ||
| Subsidies on products less taxes on products | -12.1 | -4.6 | -28.3 | -29.6 | -40.5 | -34.2 | ||
| Agricultural output at basic prices | 2,695.2 | 2,548.5 | 5,020.2 | 4,779.0 | 7,715.4 | 7,327.5 | ||
| Intermediate consumption | 2,133.8 | 1,882.1 | 3,563.0 | 3,252.9 | 5,696.8 | 5,135.0 | ||
| of which: | ||||||||
| feedingstuffs | 668.2 | 562.2 | 942.4 | 759.8 | 1,610.7 | 1,322.0 | ||
| fertilisers | 189.9 | 166.9 | 424.1 | 398.7 | 613.9 | 565.6 | ||
| financial intermediation services indirectly measured | 19.0 | 17.2 | 31.4 | 29.3 | 50.3 | 46.5 | ||
| energy and lubricants | 174.7 | 172.8 | 277.9 | 277.4 | 452.6 | 450.2 | ||
| forage plants | 508.2 | 390.1 | 780.8 | 644.5 | 1,289.0 | 1,034.5 | ||
| contract work | 123.2 | 119.0 | 242.5 | 242.9 | 365.8 | 361.9 | ||
| Gross value added at basic prices | 561.4 | 666.4 | 1,457.2 | 1,526.1 | 2,018.6 | 2,192.4 | ||
| Fixed capital consumption | 264.9 | 270.2 | 438.0 | 459.0 | 702.9 | 729.2 | ||
| Net value added at basic prices | 296.5 | 396.2 | 1,019.2 | 1,067.0 | 1,315.7 | 1,463.2 | ||
| Other subsidies less taxes on production | 689.2 | 674.9 | 867.8 | 847.9 | 1,557.0 | 1,522.9 | ||
| Factor income | 985.7 | 1,071.1 | 1,887.0 | 1,915.0 | 2,872.7 | 2,986.1 | ||
| Compensation of employees | 211.4 | 213.4 | 271.1 | 273.6 | 482.5 | 486.9 | ||
| Operating surplus 1 | 774.3 | 857.8 | 1,615.9 | 1,641.4 | 2,390.2 | 2,499.2 | ||
| 1 This is calculated before deduction of interest payments on borrowed capital and land rental paid by farmers to landowners. | ||||||||
| Table 2 Regional Agricultural Accounts at NUTS 3 level 2014 | ||||||||
| Item | Livestock | Livestock Products | Crops | Goods Output at Producer Prices | Intermediate Consumption | Gross Value Added at basic prices | Net Subsidies 1 | Operating Surplus |
| Region | ||||||||
| Border | ||||||||
| Value €m | 544.7 | 216.3 | 299.3 | 1,060.3 | 798.3 | 301.0 | 248.0 | 352.2 |
| % of State total | 17.8 | 10.0 | 16.8 | 15.1 | 15.5 | 13.7 | 16.7 | 14.1 |
| Midland | ||||||||
| Value €m | 374.6 | 142.9 | 163.6 | 681.1 | 558.5 | 154.3 | 147.6 | 140.1 |
| % of State total | 12.2 | 6.6 | 9.2 | 9.7 | 10.9 | 7.0 | 9.9 | 5.6 |
| West | ||||||||
| Value €m | 414.8 | 96.0 | 181.9 | 692.6 | 525.3 | 211.0 | 274.7 | 365.4 |
| % of State total | 13.5 | 4.5 | 10.2 | 9.9 | 10.2 | 9.6 | 18.5 | 14.6 |
| Border, Midland and Western (value €m) | 1,334.1 | 455.2 | 644.8 | 2,434.1 | 1,882.1 | 666.4 | 670.3 | 857.8 |
| Mid-East and Dublin | ||||||||
| Value €m | 296.2 | 168.9 | 334.9 | 800.0 | 515.5 | 316.6 | 127.8 | 276.3 |
| % of State total | 9.7 | 7.8 | 18.8 | 11.4 | 10.0 | 14.4 | 8.6 | 11.1 |
| Mid-West | ||||||||
| Value €m | 371.2 | 325.6 | 144.9 | 841.7 | 651.2 | 230.1 | 214.6 | 339.1 |
| % of State total | 12.1 | 15.1 | 8.1 | 12.0 | 12.7 | 10.5 | 14.4 | 13.6 |
| South-East | ||||||||
| Value €m | 540.1 | 478.0 | 395.9 | 1,414.0 | 1,090.7 | 401.7 | 212.8 | 378.2 |
| % of State total | 17.6 | 22.2 | 22.2 | 20.2 | 21.2 | 18.3 | 14.3 | 15.1 |
| South-West | ||||||||
| Value €m | 522.8 | 725.1 | 262.1 | 1,510.0 | 995.6 | 577.7 | 263.1 | 647.8 |
| % of State total | 17.1 | 33.7 | 14.7 | 21.6 | 19.4 | 26.4 | 17.7 | 25.9 |
| Southern and Eastern (value €m) | 1,730.3 | 1,697.7 | 1,137.8 | 4,565.7 | 3,252.9 | 1,526.1 | 818.3 | 1,641.4 |
| State (value €m) | 3,064.4 | 2,152.9 | 1,782.6 | 6,999.8 | 5,135.0 | 2,192.4 | 1,488.6 | 2,499.2 |
| 1 Net subsidies: Subsidies on products less taxes on products plus subsidies on production less taxes on production. | ||||||||
| Table 3 Net Subsidies1 and Operating Surplus by Region | €m | ||
| Region | |||
| 2012 | 2013 | 2014 | |
| Border | |||
| Net subsidies | 275.3 | 250.6 | 248.0 |
| Operating surplus | 317.6 | 304.5 | 352.2 |
| Net subsidies as a % of operating surplus | 86.7 | 82.3 | 70.4 |
| Midland | |||
| Net subsidies | 163.0 | 154.2 | 147.6 |
| Operating surplus | 142.1 | 129.4 | 140.1 |
| Net subsidies as a % of operating surplus | 114.7 | 119.2 | 105.3 |
| West | |||
| Net subsidies | 297.6 | 272.2 | 274.7 |
| Operating surplus | 366.6 | 340.4 | 365.4 |
| Net subsidies as a % of operating surplus | 81.2 | 80.0 | 75.2 |
| Border, Midland and Western | |||
| Net subsidies | 735.9 | 677.0 | 670.3 |
| Operating surplus | 826.3 | 774.3 | 857.8 |
| Net subsidies as a % of operating surplus | 89.1 | 87.4 | 78.1 |
| Mid-East and Dublin | |||
| Net subsidies | 137.0 | 128.5 | 127.8 |
| Operating surplus | 245.8 | 301.3 | 276.3 |
| Net subsidies as a % of operating surplus | 55.7 | 42.6 | 46.3 |
| Mid-West | |||
| Net subsidies | 239.5 | 220.9 | 214.6 |
| Operating surplus | 340.4 | 348.5 | 339.1 |
| Net subsidies as a % of operating surplus | 70.3 | 63.4 | 63.3 |
| South-East | |||
| Net subsidies | 244.2 | 222.0 | 212.8 |
| Operating surplus | 362.6 | 379.9 | 378.2 |
| Net subsidies as a % of operating surplus | 67.3 | 58.4 | 56.3 |
| South-West | |||
| Net subsidies | 297.6 | 268.2 | 263.1 |
| Operating surplus | 519.8 | 586.3 | 647.8 |
| Net subsidies as a % of operating surplus | 57.2 | 45.7 | 40.6 |
| Southern and Eastern | |||
| Net subsidies | 918.2 | 839.5 | 818.3 |
| Operating surplus | 1,468.7 | 1,615.9 | 1,641.4 |
| Net subsidies as a % of operating surplus | 62.5 | 51.9 | 49.9 |
| State | |||
| Net subsidies | 1,654.1 | 1,516.5 | 1,488.6 |
| Operating surplus | 2,295.0 | 2,390.2 | 2,499.2 |
| Net subsidies as a % of operating surplus | 72.1 | 63.4 | 59.6 |
| 1 Net subsidies: Subsidies on products less taxes on products plus subsidies on production less taxes on production. | |||
About this Release
The Regional Accounts for Agriculture release provides a regional breakdown of figures already published at State level in the Output, Input and Income in Agriculture – Final Estimate release. Both publications are prepared using similar methodology and definitions of the accounts items, which are described in the Background Notes of the Output, Input and Income in Agriculture release.
In the absence of the actual regional value data, the values of output and input accounts items at State level are apportioned to each region using a set of appropriate allocators. Derived variables, such as Gross Value Added at Basic Prices (GVA) or Operating Surplus are then calculated separately for each region. For example,
GVA at basic prices = Agricultural Output at basic prices – Intermediate consumption
Operating Surplus = GVA at basic prices – Compensation of employees
– Fixed capital consumption
+ Other subsidies less taxes on production
The choice of allocator used to distribute State values to the regions varies for each accounts item. For example, for cattle output the allocator is total number of cattle less the number of dairy cows in each region, for pigs and sheep output it is the number of pigs and sheep in June of the reference year, for milk output it is the number of dairy cows multiplied by the average output per cow in the region etc.
Most of the items of intermediate consumption, such as expenditure on fertilisers, crop protection products, energy and lubricants, maintenance and repair, veterinary expenses and expenditure on other goods and services, are allocated based on the average expenditures per farm in each region, as measured by the National Farm Survey conducted annually by Teagasc.
Due to the indirect nature of the methodology described above more reliance should be placed on the changes between the years rather than on the absolute value of the figures for any one year.
The regional results presented in this release relate to each region as a whole. Thus the regional values of the account items, including operating surplus, are not necessarily spread uniformly throughout the region.
Methodological Changes
A number of methodological changes have been introduced with this release, which may have an impact on the distribution of country totals across the regions. In particular, the allocators used for certain items were revised and updated. The release also incorporates methodological changes in calculating the State totals introduced in the Output, Input and Income in Agriculture 2014 - Final Estimate. The results for reference years 2010 - 2013 have been revised accordingly.
Regions
The regional classifications in this release are based on the NUTS (Nomenclature of Territorial Units for Statistics) classification used by Eurostat. The NUTS 3 regions correspond to the eight Regional Authorities established under the Local Government Act, 1991 (Regional Authorities) (Establishment) Order, 1993, which came into operation on 1 January 1994. The NUTS 2 regions are groupings of the NUTS 3 regions. The composition of the regions is set out below.
Border, Midland and Western NUTS 2 Region
Border Cavan, Donegal, Leitrim, Louth, Monaghan and Sligo
Midland Laois, Longford, Offaly and Westmeath
West Galway City, Galway, Mayo and Roscommon
Southern and Eastern NUTS 2 Region
Dublin Dublin City, Dun Laoghaire-Rathdown, Fingal and South Dublin
Mid-East Kildare, Meath and Wicklow
Mid-West Clare, Limerick City, Limerick and North Tipperary
South-East Carlow, Kilkenny, South Tipperary, Waterford City, Waterford and Wexford
South-West Cork City, Cork and Kerry
 Hide Background Notes
Scan the QR code below to view this release online or go to
http://www.cso.ie/en/releasesandpublications/er/raa/regionalaccountsforagriculture2014/
 Show Table 1 Regional Agriculture Accounts at Nuts 2 level 2013-2014
 Hide Table 1 Regional Agriculture Accounts at Nuts 2 level 2013-2014