| Industrial Production, Distribution and Services Provisional Data, 2017 | |||||||
| Percentage change | |||||||
| 2013 | 2014 | 2015 | 2016 | 20171 | 2016 - 2017 | 2013 - 2017 | |
| Industry | |||||||
| Turnover (€m) | 119,345 | 127,366 | 233,804 | 227,154 | 238,960 | 5.2 | 100.2 |
| Persons Engaged | 200,991 | 210,545 | 221,797 | 235,352 | 242,684 | 3.1 | 20.7 |
| Distribution | |||||||
| Turnover (€m) | 127,068 | 133,153 | 148,136 | 183,434 | 190,247 | 3.7 | 49.7 |
| Persons Engaged | 332,768 | 336,866 | 345,911 | 356,057 | 368,067 | 3.4 | 10.6 |
| Services2 | |||||||
| Turnover (€m) | 165,472 | 185,828 | 203,829 | 214,959 | 236,035 | 9.8 | 42.6 |
| Persons Engaged | 628,570 | 652,365 | 691,772 | 732,675 | 765,477 | 4.5 | 21.8 |
| Total | |||||||
| Turnover (€m) | 411,885 | 446,347 | 585,769 | 625,547 | 665,242 | 6.3 | 61.5 |
| Persons Engaged | 1,162,329 | 1,199,776 | 1,259,480 | 1,324,084 | 1,376,228 | 3.9 | 18.4 |
| 1 Provisional Data. | |||||||
| 2 Excludes Financial & Insurance activities. | |||||||
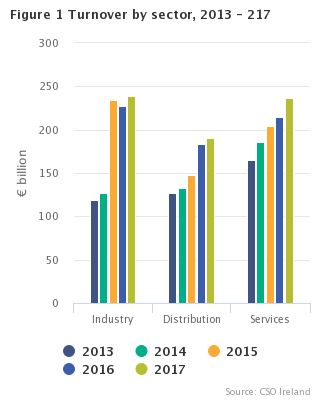
Services Turnover up 9.8% to €236 billion in 2017.
Turnover in the Services sector increased by 9.8% from 2016 levels, rising to over €236 billion in 2017. Turnover for the Industrial sector increased by 5.2% in the same year to nearly €239 billion, while turnover in the Distribution sector rose by 3.7% to over €190 billion in 2017.
The Distribution and Services sectors have grown annually in turnover in the last five years, while Industrial turnover showed a slight decrease in 2016 compared to other years.
| Persons engaged | 2013 | 2014 | 2015 | 2016 | 2017 |
|---|---|---|---|---|---|
| Industry | 200991 | 210545 | 221797 | 235352 | 242684 |
| Distribution | 332768 | 336866 | 345911 | 356057 | 368067 |
| Services | 628570 | 652365 | 691772 | 732675 | 765477 |
Almost 1.4 million persons engaged in Industry, Services & Distribution sectors in 2017
The Services sector showed an increase of over 32,800 persons engaged, a 4.5% rise between 2016 and 2017 to almost 765,500 people. Persons engaged in the Distribution sector increased by 3.4% in 2017 to almost 368,100.
The number of persons engaged in Industry increased by over 7,300 in 2017, a rise of 3.1% on 2016 levels. There are now nearly 242,700 persons engaged in Industrial Production in Ireland.
Overall the number of persons engaged in the Industry, Services & Distribution sectors increased by 18.4% in the five year period since 2013.
This release contains provisional 2017 data for Industry, Distribution and Services. Final figures for these sectors will be published in summer 2019.
| Industrial Production, Distribution and Services Provisional Data, 2017 | |||||||
| 2013 | 2014 | 2015 | 2016 | 20171 | |||
| Census of Industrial Production (B-E) | |||||||
| Turnover | €m | 119,345 | 127,366 | 233,804 | 227,154 | 238,960 | |
| Persons Engaged | No. | 200,991 | 210,545 | 221,797 | 235,352 | 242,684 | |
| of which | |||||||
| Mining & quarrying (B) | |||||||
| Turnover | €m | 1,093 | 1,054 | 972 | 1,365 | 1,457 | |
| Persons Engaged | No. | 4,146 | 4,058 | 4,164 | 4,058 | 4,089 | |
| Manufacturing (C) | |||||||
| Turnover | €m | 108,202 | 117,149 | 223,288 | 215,789 | 226,929 | |
| Persons Engaged | No. | 181,091 | 189,966 | 200,047 | 213,117 | 218,659 | |
| Electricity, gas , steam and air conditioning supply (D) | |||||||
| Turnover | €m | 8,712 | 7,763 | 8,013 | 8,213 | 8,660 | |
| Persons Engaged | No. | 8,246 | 8,496 | 8,846 | 9,206 | 10,998 | |
| Water supply; sewerage,waste management and remediation activities (E) | |||||||
| Turnover | €m | 1,339 | 1,400 | 1,531 | 1,787 | 1,914 | |
| Persons Engaged | No. | 7,508 | 8,025 | 8,740 | 8,971 | 8,938 | |
| Annual Services (G-N, R92,R93,S95,S96 excluding K) | |||||||
| Turnover | €m | 292,540 | 318,981 | 351,965 | 398,393 | 426,282 | |
| Persons Engaged | No. | 961,338 | 989,231 | 1,037,683 | 1,088,732 | 1,133,544 | |
| of which | |||||||
| Distribution (G) | |||||||
| Turnover | €m | 127,068 | 133,153 | 148,136 | 183,434 | 190,247 | |
| Persons Engaged | No. | 332,768 | 336,866 | 345,911 | 356,057 | 368,067 | |
| Services (H-N, R92,R93,S95,S96 excluding K) | |||||||
| Turnover | €m | 165,472 | 185,828 | 203,829 | 214,959 | 236,035 | |
| Persons Engaged | No. | 628,570 | 652,365 | 691,772 | 732,675 | 765,477 | |
| 1 Provisional Data | |||||||
| See background notes for detailed classifications | |||||||
Provisional Data 2017
The data in this release are taken from the Annual Services Inquiry 2017 (ASI) and the Census of Industrial Production 2017 (CIP), which are compulsory surveys conducted under the Statistics (Structural Business Inquiries) Order 2017 (S.I. No. 572 of 2017), made under the Statistics Act 1993 and Regulation (EC) No 295. of 2008 of the European Parliament and of the Council concerning structural business statistics.
Appreciation is extended to firms that co-operate in these surveys. The information they provide is treated as strictly confidential to the Central Statistics Office. Direct or indirect disclosure of information relating to individual respondents is avoided in the publication of results by combining categories containing small numbers of units and suppressing figures, etc.
The individual Surveys are conducted as follows
Annual Services Inquiry
The Annual Services Inquiry (ASI) has been conducted on annual basis since 1991. The purpose of the survey is to provide grossed estimates of the principal trading aggregates for all enterprises in the retail, wholesale, transportation and storage, accommodation and food, information and communication, real estate, professional, scientific, technical, administrative and other selected services sectors.
Legislation
The Annual Services Inquiry is a compulsory survey conducted under the Statistics (Structural Business Inquiries) Order 2017 (S.I. No. 572 of 2017), made under the Statistics Act 1993 and Regulation (EC) No. 295 of 2008 of the European Parliament and of the Council concerning structural business statistics.
Central Business Register
The CSO’s Central Business Register provides the sampling frame from which the Annual Services Inquiry sample is selected each year. The Central Business Register is also used as the basis for the sampling frame used to gross sample data to the population. The Business Register is updated continuously throughout the year.
Sample Design
The ASI is designed to provide grossed estimates of the principal trading aggregates for all enterprises in the relevant sectors. The ‘enterprise’ is the unit used for survey purposes i.e. one return is sought in respect of each enterprise covering all constituent branches, local units or subsidiaries. The sample is selected based on the number of persons engaged in the enterprise i.e. number of proprietors plus number of full-time and part-time staff. A census of enterprises with 20 or more persons engaged is conducted. In addition a stratified random sample is selected for the enterprises with less than 20 persons engaged, with decreasing sampling proportions taken in the lower persons engaged ranges.
All enterprises with 1 or more persons engaged are included in the survey frame. However, the units with 1 person engaged are not surveyed; the data for these are imputed directly from administrative data sources.
Grossing
Collected and edited data for companies with 2 or more persons engaged is aggregated using ratio estimators (a general estimator for the population total). Number of Persons Engaged is known for all members of the population and used as an auxiliary parameter for all monetary and employment variables.
Horvitz-Thomson estimator is used for number of enterprises and number of local units.
This process results in assigning every company on the final dataset two grossing factors (weights) dependent on the NACE code and employment size class . The underlying assumption in the ratio estimator strategy is that a variable of interest (e.g. turnover) and the auxiliary parameter (employment) are linearly connected. Units, for which this assumption is strongly violated (outliers), are identified and adjusted if necessary.
The data for units with 1 person engaged is imputed from administrative data sources directly, where possible. Variables that are not available, such as capital acquisitions and disposals, are modelled using linear regressions from respondents with 2 to 9 persons engaged. Horvitz-Thomson estimator is used to gross the data to account for units which have no administrative data available.
Number of Persons Engaged includes all full time and part-time employees. It also includes proprietors, partners and family members who work for an enterprise. It excludes agency workers.
The Census of Industrial Enterprises covers those enterprises which are wholly or primarily engaged in industrial production and have three or more persons engaged.
The Census of Industrial Production is required under Council Regulation (EC, Euratom) No 58/97. The 2017 Census was taken in accordance with S.I. No. 572/2017.
An enterprise is defined as the smallest combination of legal units that is an organisational unit producing goods or services, which benefits from a certain degree of autonomy in decision making, especially for the allocation of its current resources.
Period Covered by the Census
Although the Census relates in principle to the calendar year, respondents are permitted to return figures for their nearest accounting year. The end of the accounting year for all returns used falls between May of the reference year and April of the following year. Returns which cover a period of less than 12 months are accepted in cases where businesses have started or ceased trading during the year.
All employment details in the 2017 Census are based of the average employment reported on the enterprise’s P35.
Data Collection
The Census is conducted by post and electronic data collection. A permanent up-to-date register is kept of all relevant enterprises involved in industrial production. The register is maintained from the Central Business Register, administrative and public utility records, announcements in the press, business journals, etc. This register is constantly being updated. This results in differing estimates for the total number of enterprises through the dissemination cycle.
An ‘enterprise’ questionnaire is sent to all enterprises whose activity is primarily industrial. The type of ‘enterprise’ questionnaire depends on the size of the enterprise. The most detailed form (form F) is generally sent to all enterprises with twenty or more persons engaged. A less detailed form (form C) is sent to enterprises with between three and twenty persons engaged.
All forms are available on CSO’s website at
http://www.cso.ie/surveysandmethodologies/surveyforms/indus_production.htm
All returns are scrutinised clerically for internal accuracy. They are compared with returns for previous years and in some instances with returns to other industrial inquiries. A further set of consistency checks are carried out in the computer processing of the data. Substantial queries arising from these scrutiny operations are referred to the respondent by telephone or in writing.
NACE Classification
NACE refers to the classification NACE Revision 2 which is the European Union’s Statistical Classification of Economic Activity in the European communities.
For further information on the NACE Rev. 2 classification of industrial activity, visit the CSO website:
http://www.cso.ie/en/surveysandmethodology/classifications/
The traditional category Transportable Goods Industries used in industrial statistics is equivalent to NACE sections B and C. The Manufacturing Industries grouping includes only section C.
NACE Rev. 2 Classification
NACE Rev. 2 is the statistical classification of economic activities. NACE is an acronym for ‘Nomenclature Généraile des Activités Économiques dans les Communautés Européenes’ (General Industrial Classification of Economic Activities within the European Communities).
The information presented in this report covers the industry, distributive trade and services (excl Financials).
The following highlights the composition of these sectors in this report
Industry Section B – Mining and quarrying
Section C - Manufacturing
Section D – Electricity, gas, steam and air conditioning supply
Section E - Water supply; sewerage, waste management and remediation activities
Distributive Trade Section G - Wholesale and retail trade; repair of motor vehicles and motorcycles
Services Section H - Transportation and storage
Section I - Accommodation and food service activities
Section J - Information and communication
Section L - Real estate activities
Section M - Professional, scientific and technical activities
Section N - Administrative and support service activities
Section R - Arts, entertainment and recreation
Section S - Other service activities
Financial and insurance activities Section K - Financial and insurance activities are excluded from this report.
 Hide Background Notes
Scan the QR code below to view this release online or go to
http://www.cso.ie/en/releasesandpublications/er/ipdsp/industrialproductiondistributionandservicesprovisionaldata2017/
 Show Table 1 Industrial Production, Distribution and Services Detailed Provisional Data, 2017
 Hide Table 1 Industrial Production, Distribution and Services Detailed Provisional Data, 2017