In April 2016 there were 29,186 Romanian nationals usually resident in Ireland. The Romanian population increased by 69 per cent between 2011 and 2016. With a population growth of 11,882 persons between 2011 and 2016, this was the greatest increase in population size seen among all ten non-Irish nationalities profiled.
| Table 5.1 Population Usually Resident by Nationality and Census Year | |||
| 2006 | 2011 | 2016 | |
| Romanian | 7,696 | 17,304 | 29,186 |
It's a Fact
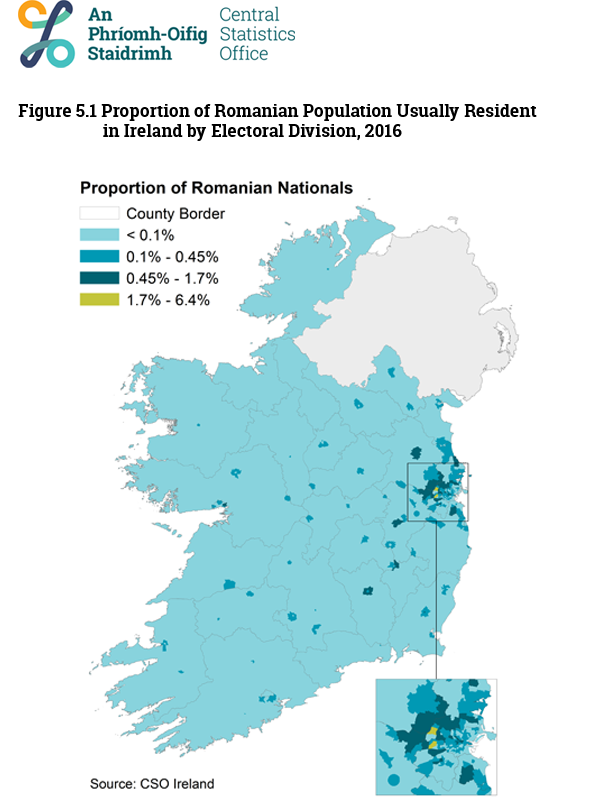
16,808 Romanian nationals were living in Dublin city and suburbs, this accounted for 58 per cent of the Romanian population usually resident in Ireland. As seen in Figure 5.1, the Romanian population was mainly based around Dublin suburbs and commuter towns.
In April 2016, 75 per cent of the Romanian population was aged 38 years and younger, compared with 54 per cent of the usual residents in the State. Furthermore, only 6 per cent of the Romanian population was aged 50 years and older. In comparison, 30 per cent of the State's population was aged 50 years and over.
The age breakdown of the Romanian and State populations can be seen by clicking an option below:
| Table 5.2 Population Usually Resident in the State by Nationality, Average Age, and Census Year | |||
| 2006 | 2011 | 2016 | |
| Romanian | 28.8 | 29.6 | 30.5 |
| State | 35.5 | 36.1 | 37.3 |
The average age of the Romanian population usually resident in Ireland increased by less than 1 year between 2011 and 2016, from 29.6 years to 30.5 years.
| Retired, unable to work or other economic status | Student or pupil | Looking after home/family | Unemployed | Persons at work | |
| State - 2016 | 704262 | 415555 | 303034 | 294006 | 1970728 |
| Romanian - 2016 | 824 | 1337 | 2044 | 3426 | 17134 |
| Romanian - 2011 | 486 | 1119 | 1525 | 3667 | 8057 |
While the population increased between 2011 and 2016, the proportion of Romanian nationals aged 15 years to 64 years remained relatively unchanged. However, the proportion of Romanian nationals at work increased from 54 per cent (8,057 persons) in 2011, to 69 per cent (17,134 persons) in 2016, compared with 53 per cent for the State in 2016. The unemployment rate among Romanian nationals was 17 per cent (3,426 persons), while the census national unemployment rate of the State’s population in 2016 was 13 per cent.
It's a Fact
Table 5.3 shows the top three broad industrial groups for the Romanian population at work and usually resident in Ireland in April 2016. 20 per cent of Romanian nationals who were at work were in the accommodation and food services industry (3,494 persons), the greatest number of Romanian nationals in any one industry. Kitchen assistants and chefs within this industry accounted for 9 per cent of all Romanian nationals at work (5% and 4% respectively).
11 per cent of Romanian nationals at work were in the construction industry (1,808 Romanians). This was the highest proportion of all nationalities profiled. Within this industry conveyers of building materials, general labourers, and other elementary construction occupations were prevalent among Romanian nationals.
| Table 5.3 Population Aged 15 Years and Over, at Work, by Nationality and Broad Industrial Group, 2016 | ||
| Romanian | State | |
| At Work | 17,134 | 1,970,728 |
| Accommodation & food services | 20% | 6% |
| Wholesale and retail trade; repair of motor vehicles and cycles | 12% | 13% |
| Administrative & support services | 11% | 4% |
| Construction | 11% | 5% |
Table 5.4 shows the top three broad occupational groups for the Romanian population at work and usually resident in Ireland in April 2016. 5,418 Romanian nationals who were at work were in elementary occupations (32%), significantly higher than the proportion of the State in the same occupational group (9%). A further 18 per cent of Romanian nationals who were at work were in skilled trades occupations (3,085 Romanians). In both cases, these were the highest proportions of all nationalities profiled to be in these two occupational groups.
| Table 5.4 Population Aged 15 Years and Over, at Work, by Nationality and Broad Occupational Group, 2016 | ||
| Romanian | State | |
| At Work | 17,134 | 1,970,728 |
| Elementary Occupations | 32% | 9% |
| Skilled Trades Occupations | 18% | 14% |
| Process, Plant, and Machine Operative Occupations & Transport | 10% | 7% |
It's a Fact
Almost 60 per cent of Romanian nationals living in Ireland were aged between 25 years and 44 years old in April 2016 (17,258 persons). The proportions of Romanian nationals at each level of education largely mirrored that of the population of the State in the same age group.
| Postgraduate degree | Third level degree/professional qualification or both | Upper secondary, technical, vocational | Lower secondary, primary, no formal education, not stated | |
| State | 336913 | 1015481 | 1032231 | 1302960 |
| Romanian | 1544 | 6873 | 8146 | 8202 |
It's a Fact
| Widowed | Separated (inc. divorced) | Married (inc. same-sex civil partnership) | Single | |
| State | 193360 | 217618 | 1762837 | 1513770 |
| Romanian | 281 | 1493 | 13577 | 9414 |