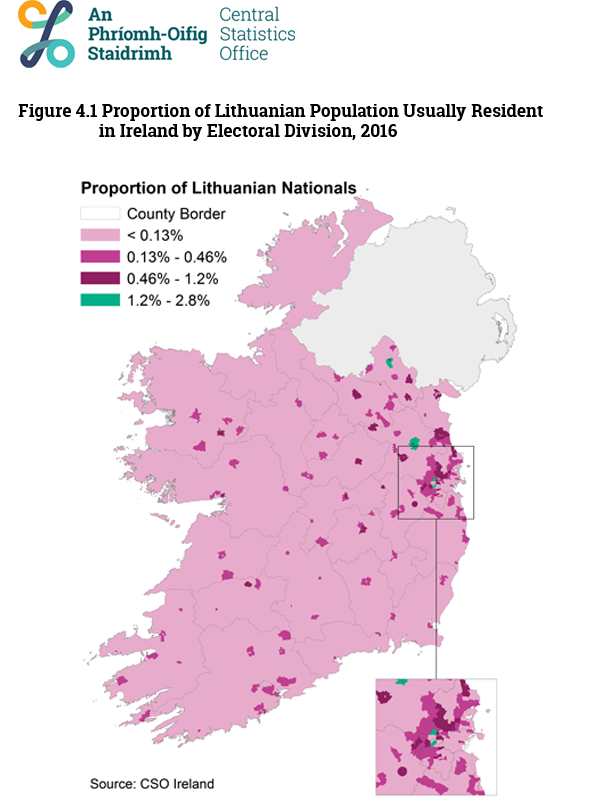
In April 2016 there were 36,552 Lithuanian nationals living in Ireland. The usually resident Lithuanian population decreased by less than 1 per cent between Census 2016 and 2011.
| Table 4.1: Population Usually Resident by Nationality and Census Year | |||
| 2006 | 2011 | 2016 | |
| Lithuanian | 24,628 | 36,683 | 36,552 |
Overall more than one quarter of all Lithuanian nationals who were living in Ireland lived in county Dublin (9,869 persons). As visible in the inset of Figure 4.1, a high proportion of Lithuanian nationals were living in the suburbs of Dublin and towns in neighbouring counties. Outside of Dublin, Navan, Drogheda, and Monaghan towns were the most popular towns to live in. 3,409 Lithuanians were living in these areas combined (9% of the Lithuanian population).

It's a Fact
The average age of a Lithuanian national in Ireland increased by 3 years between 2011 and 2016, from 28.7 years to 31.8 years.
| Table 4.2 Population Usually Resident in the State by Nationality, Average Age, and Census Year | |||
| 2006 | 2011 | 2016 | |
| Lithuanian | 28.2 | 28.7 | 31.8 |
| State | 35.5 | 36.1 | 37.3 |
The age breakdown of the Lithuanian and State populations can be seen by clicking an option below:
In April 2016, 30,670 Lithuanian nationals were aged 15 years and over. The proportion of the Lithuanian population at work was higher than the proportion of the State’s population in April 2016. This was likely due to the high proportion of the Lithuanian population aged 15 years to 64 years (80% of the Lithuanian population) and the low proportion of retirees (<1%).
| Unable to work, retired or other economic status | Looking after home/family | Student or pupil | Unemployed | Persons at work | |
| State | 704262 | 303034 | 415555 | 294006 | 1970728 |
| Lithuanian | 1030 | 1578 | 2642 | 3746 | 21674 |
Table 4.3 shows the top three broad industrial groups among the Lithuanian population aged 15 years and over, usually resident in Ireland, in April 2016 and the proportion of the population at work in each industry. 23 per cent of Lithuanian nationals were at work in the retail industry (2,669 persons), making it the industry with the greatest number of Lithuanian nationals. Retail managers, cashiers and mechanics/electricians were the dominant occupations among Lithuanian nationals at work in this industry.
| Table 4.3 Population Aged 15 Years and Over, at Work, by Nationality and Broad Industrial Group, 2016 | ||
| Lithuanian | State | |
| At Work | 21,674 | 1,970,728 |
| Wholesale and retail trade; repair of motor vehicles and cycles | 23% | 13% |
| Manufacturing | 16% | 10% |
| Accommodation and food service activities | 12% | 6% |
Table 4.4 shows the top three broad occupational groups for the Lithuanian population at work and usually resident in Ireland, in April 2016. Almost one quarter of all Lithuanian nationals at work were in elementary occupations (5,245 persons) - cleaners and domestics were the dominant category within this group (1,451 persons) - making it the most common occupational group among the Lithuanian population in Ireland.
Many were working as machine operators in manufacturing (3,849 persons, 18% of those at work). Of these, one third were employed in food, drink, or tobacco factories (1,516 Lithuanians).
| Table 4.4 Population Aged 15 Years and Over, at Work, by Nationality and Broad Occupational Group, 2016 | ||
| Lithuanian | State | |
| At Work | 21,674 | 1,970,728 |
| Elementary Occupations | 24% | 9% |
| Process, Plant, and Machine Operative Occupations & Transport | 18% | 7% |
| Skilled Trades Occupations | 15% | 14% |
In April 2016, there were 13,286 permanent private households headed by a Lithuanian national. 11,016 Lithuanian headed households contained family units. Furthermore, 8,787 of these households were family units with children. These family units with children accounted for 80 per cent of all family units headed by a Lithuanian national. Of the nationalities profiled, only among Latvian headed households were there more family units with children.
| Children both under and over 15 years | All children aged 15 years and over | All children aged under 15 years | |
| State | 127846 | 328684 | 406191 |
| Lithuanian | 1125 | 1487 | 6175 |
70 per cent of family units in the State had children. Compared with family units headed by a Lithuanian, there was a greater proportion of families in the State with older children. 53 per cent of families with children in the State had at least one child aged 15 years and over, while 70 per cent of families with children headed by a Lithuanian national comprised of only children under 15 years of age.
It's a Fact